CORN Help
Database function module introduction
Search by condition
Researchers can use this function to search TRSNs inferred from experimental results by selecting through different interested conditions.
In the following options box, select the corresponding experimental conditions such as: experimental compound, compound concentration, interference time, cell line.

And then press Summit!
Where you can find the result page. Showing the TRSN ID, conditions specified and the transcription factor (TF) responsible for the regulation of this TRSN.

Click TRSN ID CN314 as an example.
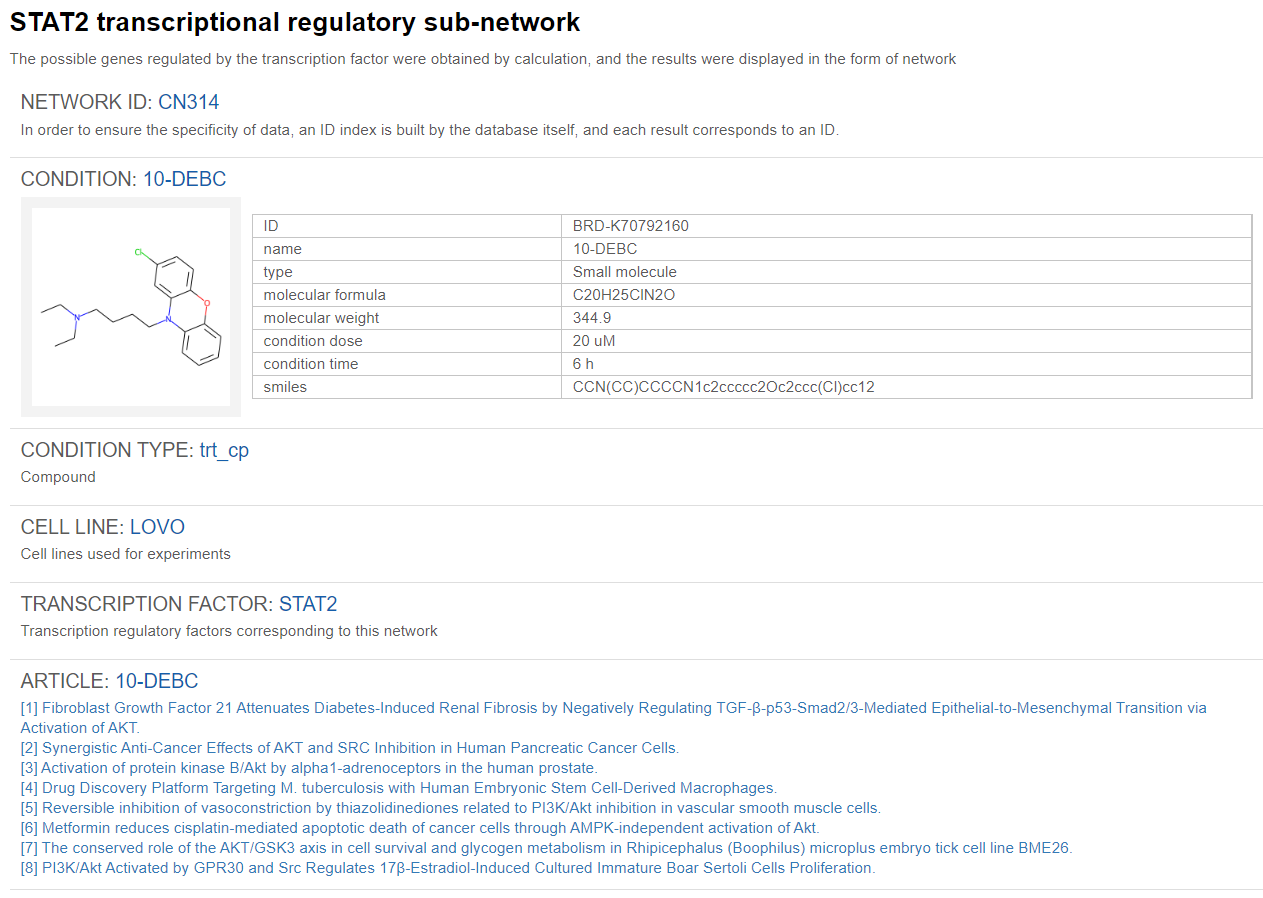
Information about the corresponding condition will be specified, such as the type of condition/chemical used (compound/ peptides and other biological agents/ shRNA/ cDNA/ CRISPR…etc), the chemical/small molecule name, the chemical structure, molecular formula, molecular mass, simplified molecular-input line-entry system (smiles) for the chemical used, and the transcription factor identified to regulate the whole TRSN. Links to papers related to this condition will also be provided below the conditional information.
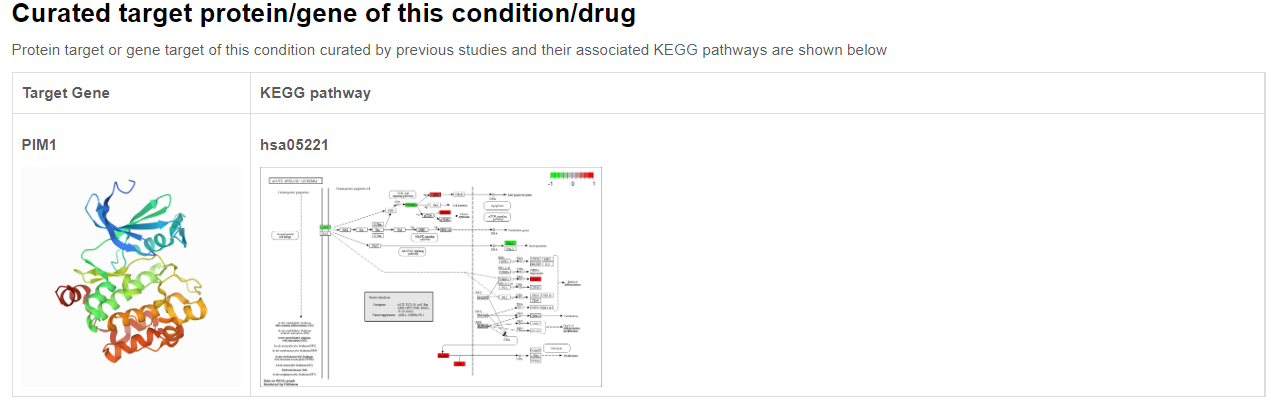
If the corresponding condition has a curated target (for example, the ligand of a chemical/target gene of CRISPR), extra information about this target will also be provided, such its protein structure and its associated KEGG pathways.
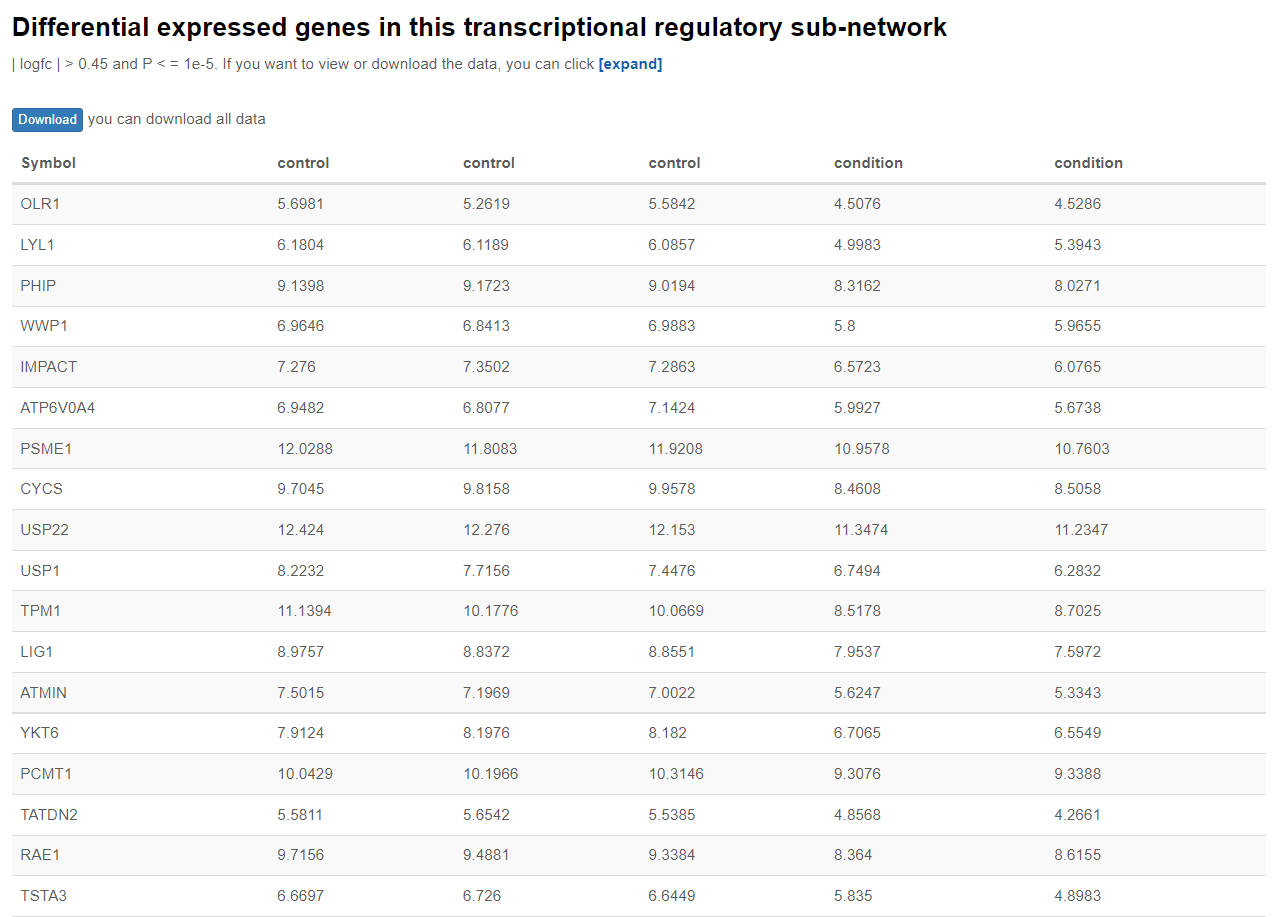
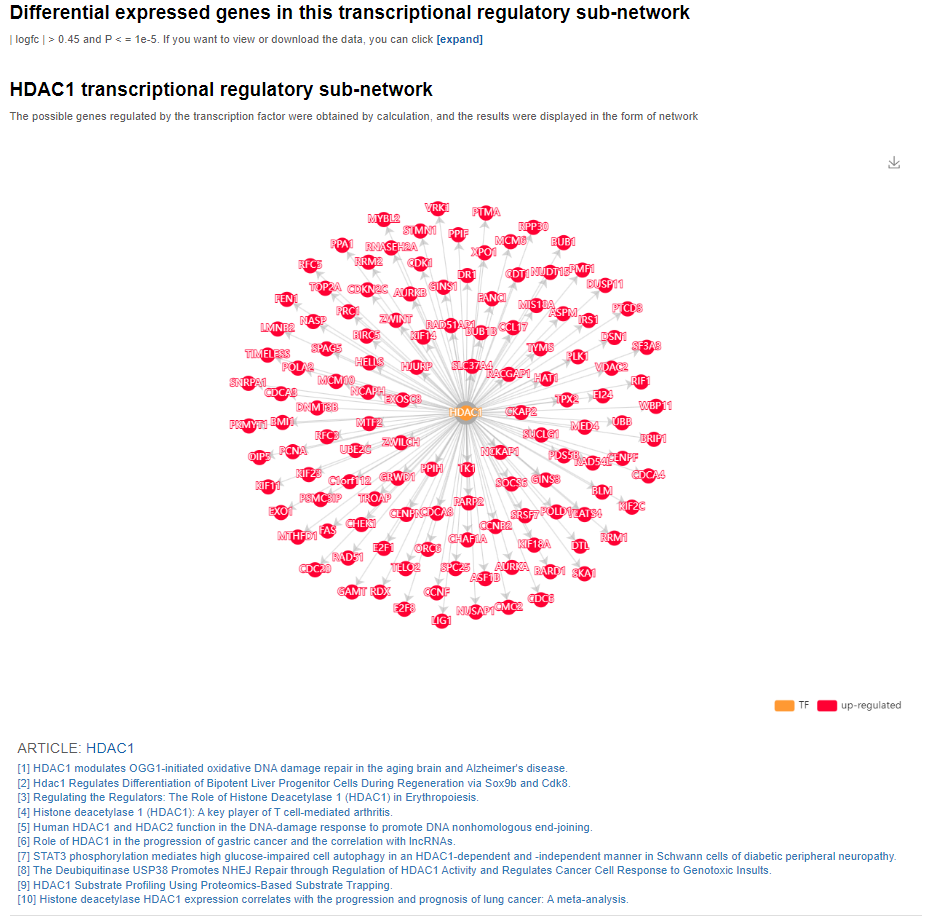
A table indicating differentially expressed genes(| logfc | > 0.45 and P < = 1e-5) being regulated in this TRSN will be shown with their expression level during the specified condition and during control condition. But this table is being hidden by default, to show this table please click “expand”.
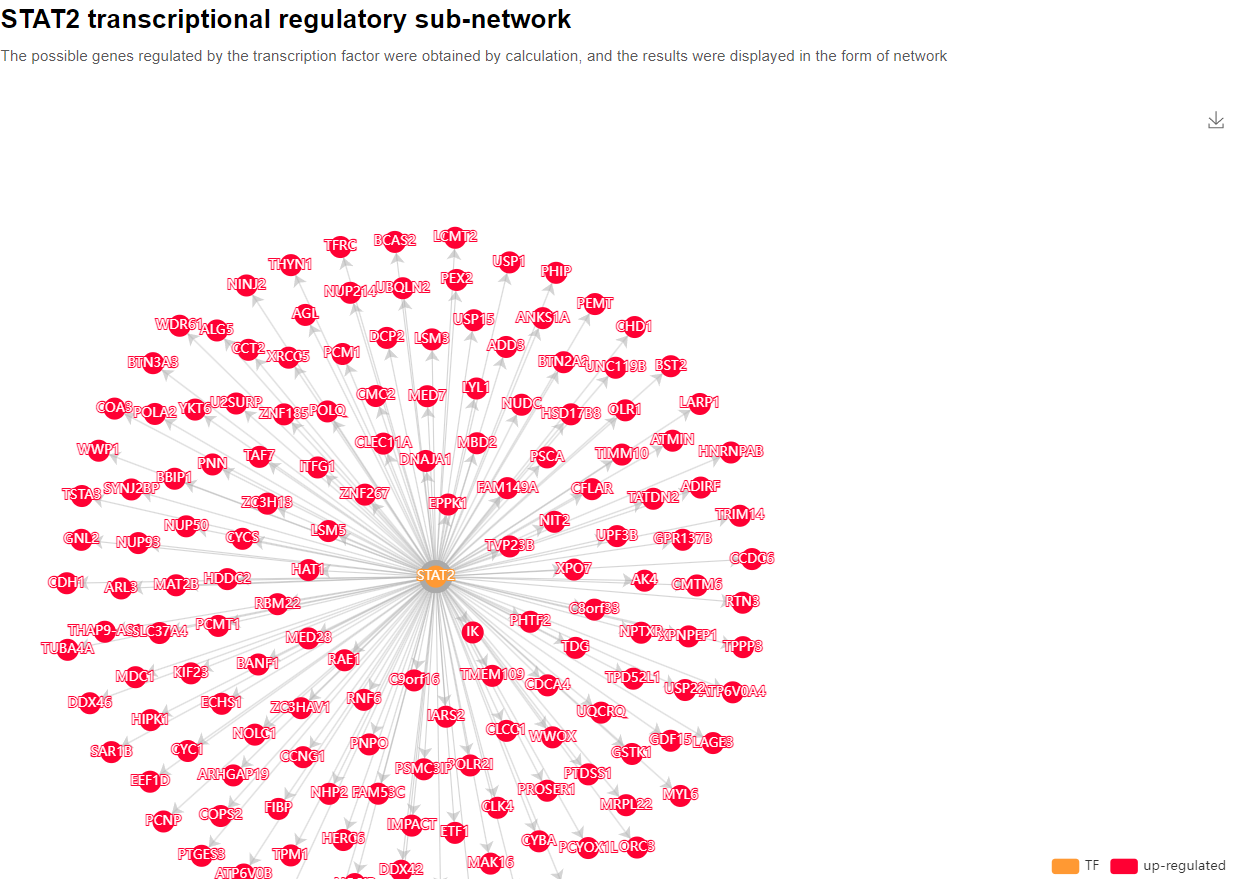
Furthermore, a transcriptional regulatory network map will also be provided to illustrate the relationship between the transcription factor and the associated target genes. Also, articles related to this transcription factor would also be provided below the transcriptional regulatory network map.
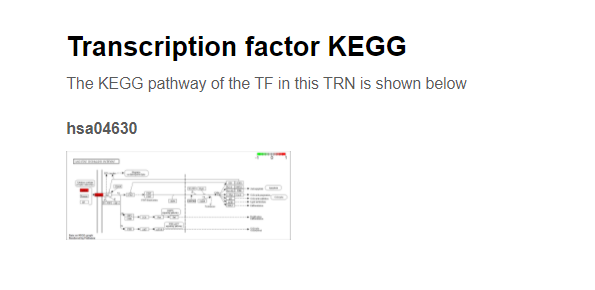
Further down below, the KEGG pathways for this TF in this TRSN would also be provided.
Matching regulatory sub-networks to your transcriptomic alterations
Find this tool right here!

By inputting a list of differentially expressed genes and their level of alterations in terms of log2 fold change. (For example: the gene expression alterations between normal tissue and cancer tissue) Our tool can help you to match condition associated TRSNs with similar gene alterations. Therefore, TRSN associated small molecules or drugs inducing such gene alterations can be viewed as potential drug target amending the inputted transcriptomic changes. (Curing diseases statues)
First, input two columns of information, the first column is the symbol name of differentially expression gene, the second column is the log2 fold change of the gene, the first row is the header. Use tabs or spaces to separate the two columns.

Click "Demo" and then "Search", you will see a demo of the usage and the matching result.
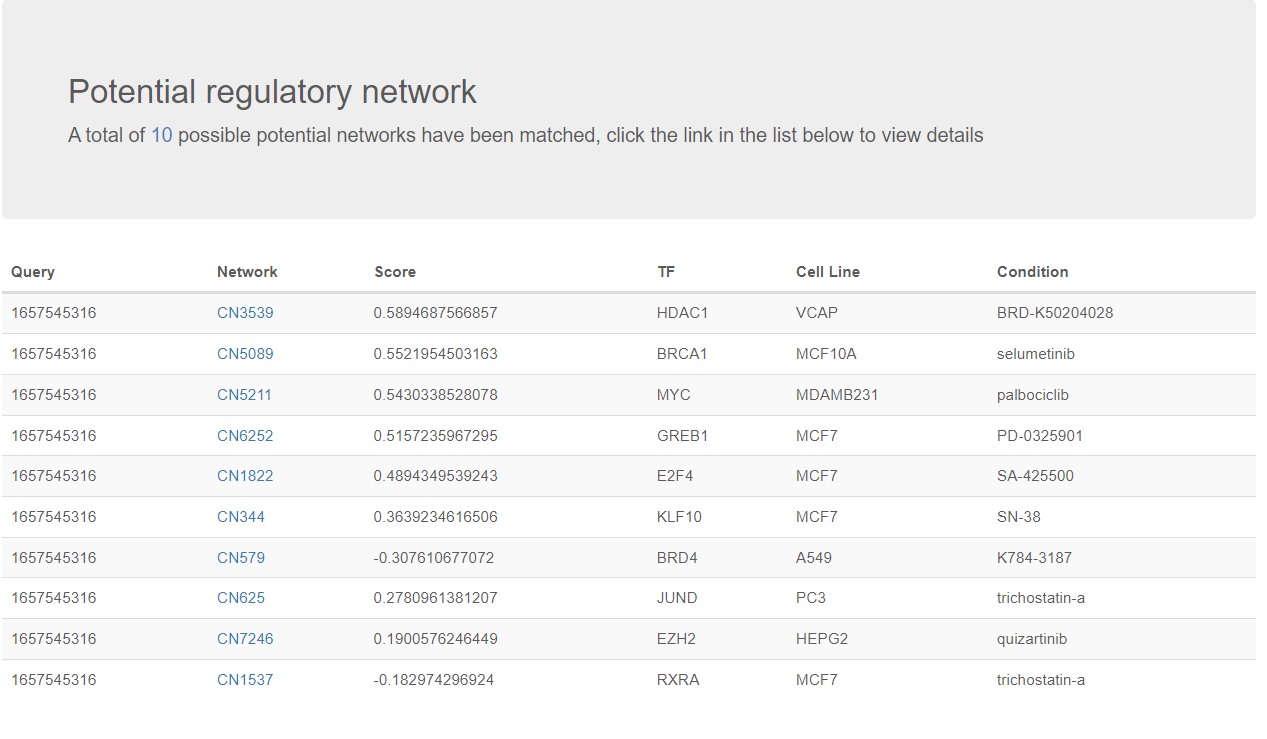
The matching result would show 10 possible potential networks have been matched. Condition (eg: drug used for treatment) and the TF involved are provided. The best combination of networks in this cite could be searched to greatly cover the change of genes. Here the 'score' represents the weights of selected networks in the best combination.
If you click the Network ID, in this case its “CN3539”. A detailed page describing the TRSN would be shown.

List of differentially expressed genes and a TRSN diagram is provided,too.